Seglayer2lattice
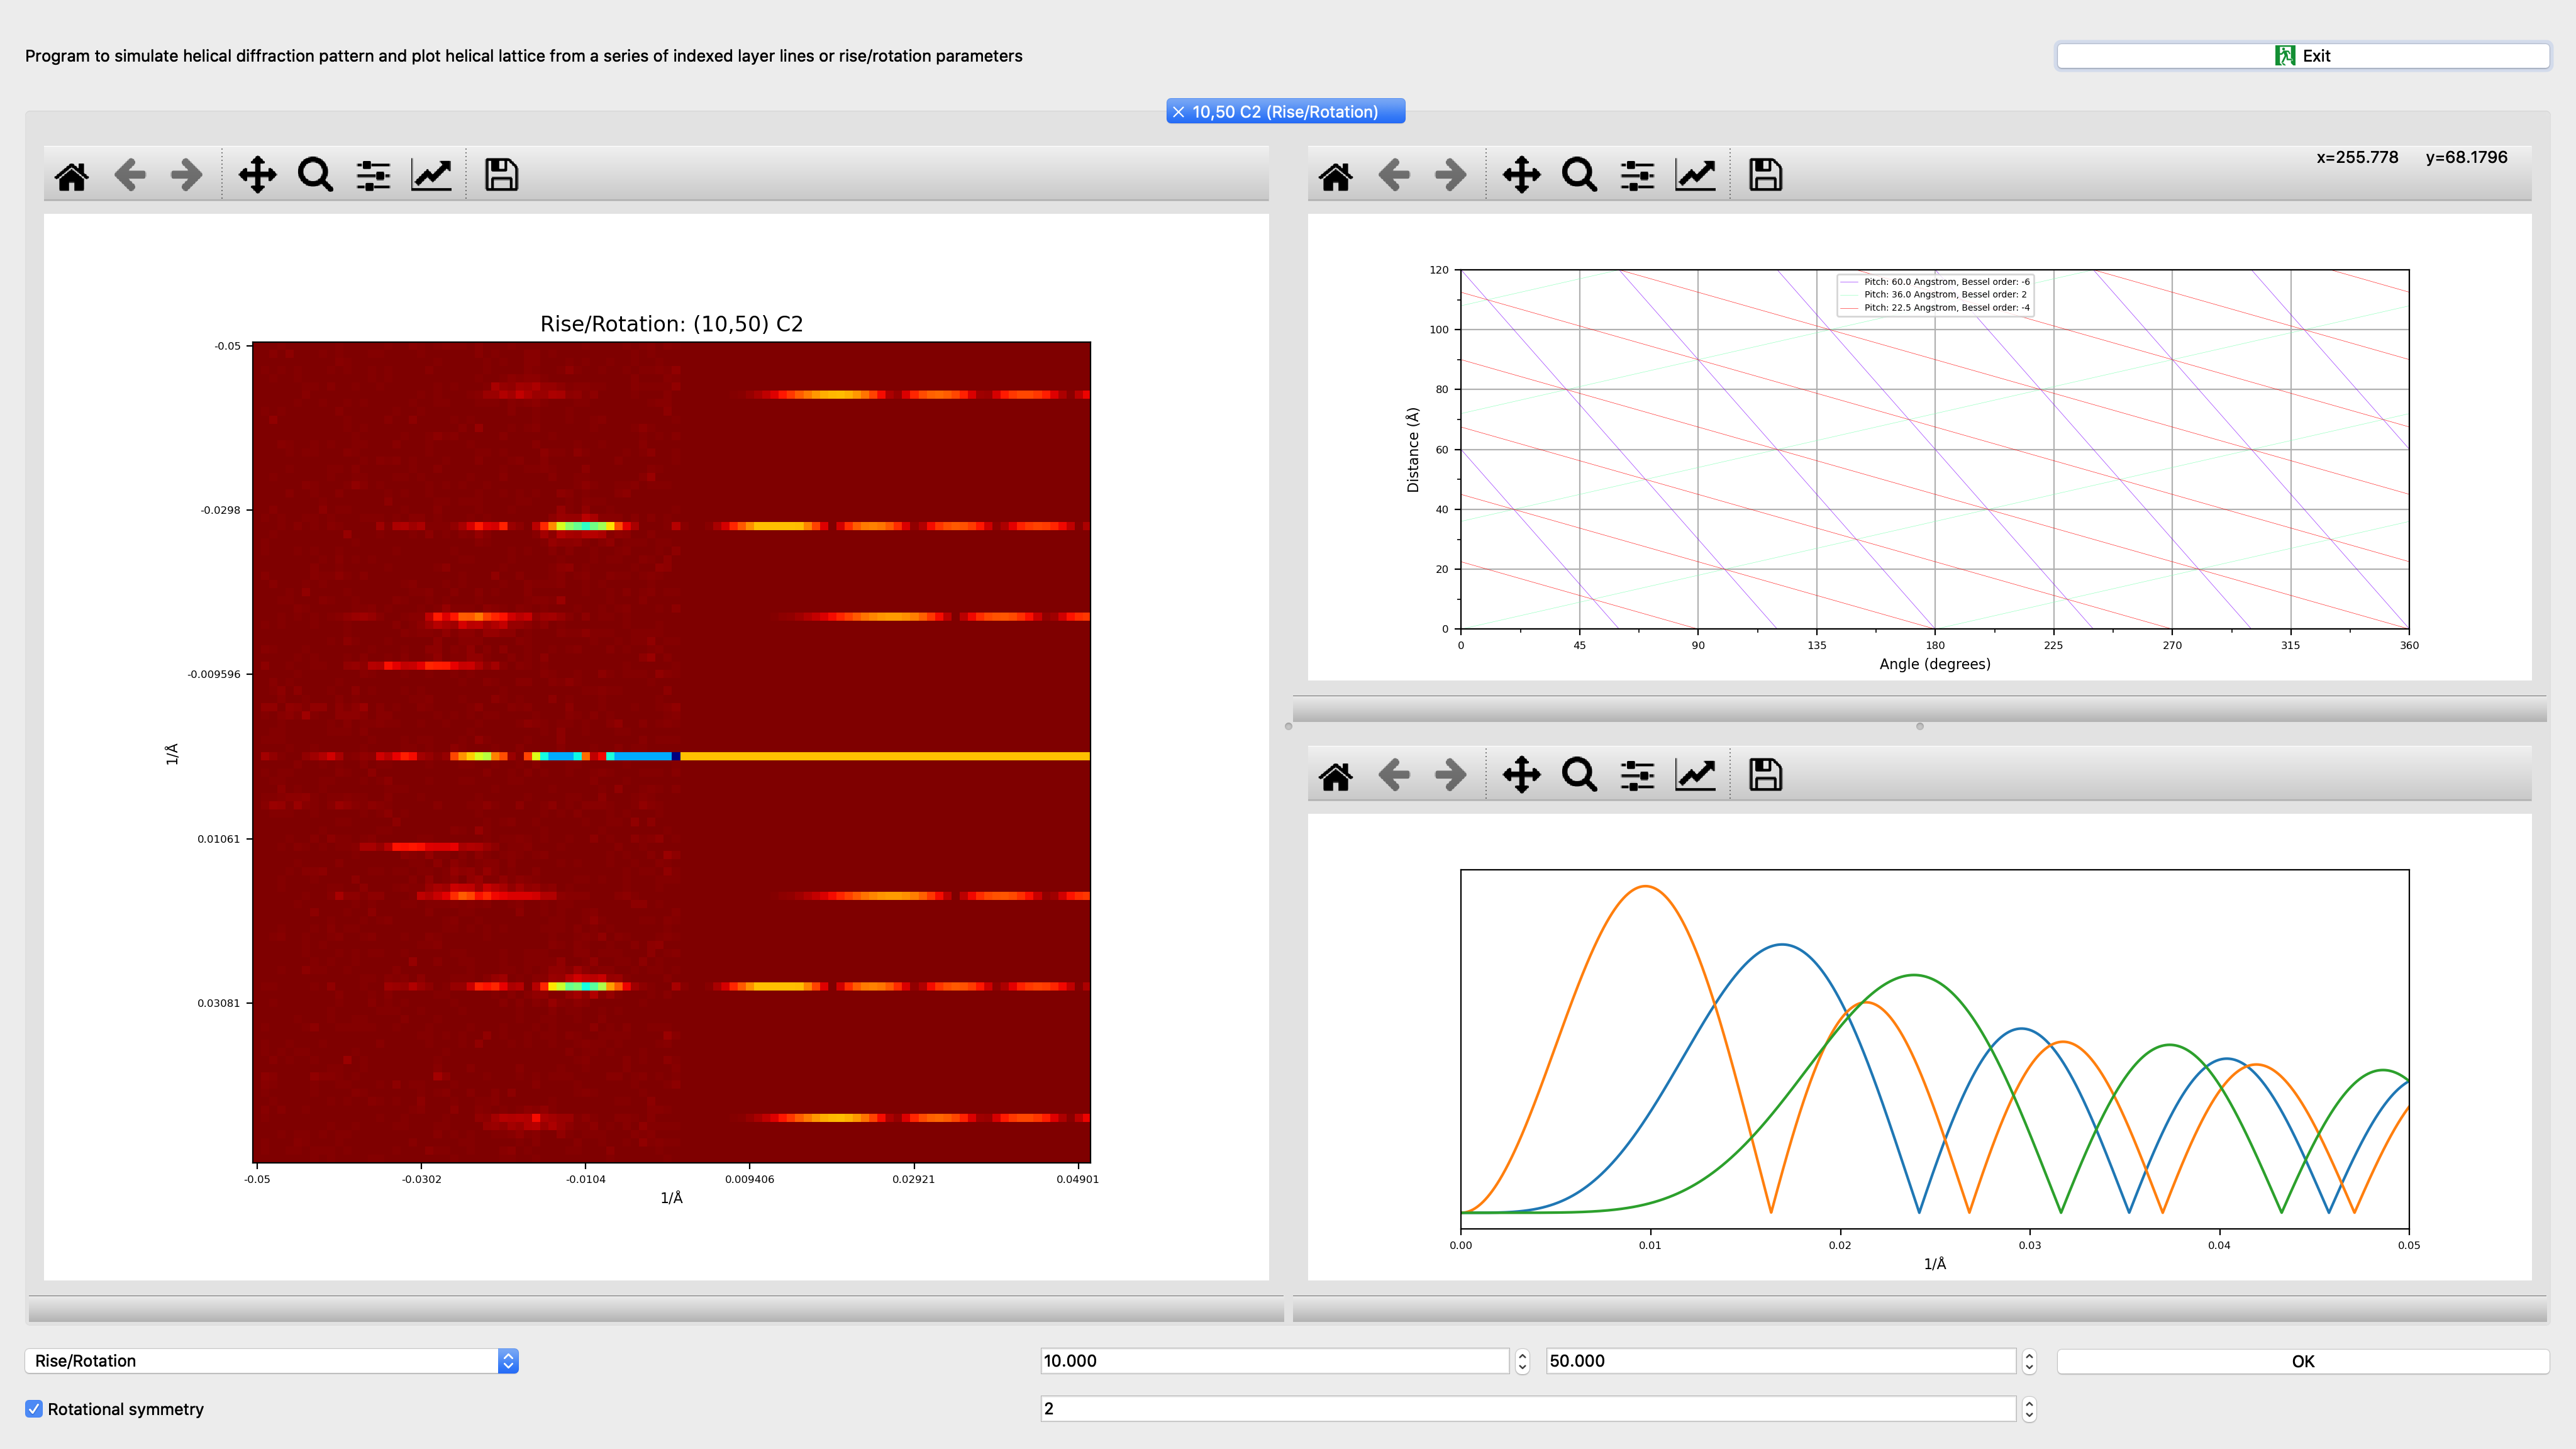
Program to simulate helical diffraction pattern and plot helical lattice from a series of indexed layer lines or rise/rotation parameters
Parameters
Parameter |
Example (default) |
Description |
|---|---|---|
Analyze power spectrum |
True |
Option to analyze experimental power spectrum. |
Power spectrum input image |
power.hdf |
Input power spectrum image: accepted file formats (hdf). |
Batch mode |
False |
Batch mode for plot. Otherwise interactive. |
Diagnostic plot |
seglayer2lattice_diag.pdf |
Output diagnostic plot: accepted file formats (pdf, .png, .bmp, .emf, .eps, .gif, .jpeg, .jpg, .ps, .raw, .rgba, .svg, .svgz, .tif, .tiff). |
Pixel size in Angstrom |
1.163 |
Pixel size is an imaging parameter (accepted values min=0.001, max=100). |
Layer line/Bessel order or helical rise/rotation choice |
rise/rotation |
Choose whether ‘layer/bessel’, ‘rise/rotation’ or ‘pitch/unit_number ‘ pairs are given for generating the helical lattice. |
Layer line/Bessel or rise/rotation pair(s) |
(0.03, 2); (0.06, -4); (0.09, 6) |
List of comma-separated pairs in brackets. Pairs are separated by semicolon. (Layer line position [1/Angstrom], Bessel order [integer]) or (Helical rise [Angstrom], rotation [degrees]) |
Precise helix width in Angstrom |
180 |
Precise width of helix for layer line interpretation (accepted values min=20, max=1500). |
Sample parameter file
You may run the program in the command line by providing the parameters via a text file:
seglayer2lattice --f parameterfile.txt
Where the format of the parameters is:
Analyze power spectrum                   = True
Power spectrum input image               = power.hdf
Batch mode                               = False
Diagnostic plot                          = seglayer2lattice_diag.pdf
Pixel size in Angstrom                   = 1.163
Layer line/Bessel order or helical rise/rotation choice = rise/rotation
Layer line/Bessel or rise/rotation pair(s) = (0.03, 2); (0.06, -4); (0.09, 6)
Precise helix width in Angstrom          = 180
Additional parameters (intermediate level)
Parameter |
Example (default) |
Description |
|---|---|---|
High-pass filter option |
False |
Option to high-pass filter images before alignment or band-pass filter in combination with low-pass filter. |
Low-pass filter option |
True |
Option to low-pass filter images before alignment or band-pass filter in combination with high-pass filter. |
High and low-pass filter cutoffs in 1/Angstrom |
(0.001, 0.09) |
Filter design for high- and low-pass filter with cutoffs in 1/Angstrom. Maximum spatial frequency is 1/(2*pixelsize) (accepted values min=0, max=1). |
Rotational symmetry |
1 |
Additional x-fold rotational symmetry or x-number of helix start (accepted values min=1, max=100). |
Sample parameter file (intermediate level)
You may run the program in the command line by providing the parameters via a text file:
seglayer2lattice --f parameterfile.txt
Where the format of the parameters is:
Analyze power spectrum                   = True
Power spectrum input image               = power.hdf
Batch mode                               = False
Diagnostic plot                          = seglayer2lattice_diag.pdf
Pixel size in Angstrom                   = 1.163
High-pass filter option                  = False
Low-pass filter option                   = True
High and low-pass filter cutoffs in 1/Angstrom = (0.001, 0.09)
Layer line/Bessel order or helical rise/rotation choice = rise/rotation
Layer line/Bessel or rise/rotation pair(s) = (0.03, 2); (0.06, -4); (0.09, 6)
Rotational symmetry                      = 1
Precise helix width in Angstrom          = 180
Additional parameters (expert level)
Parameter |
Example (default) |
Description |
|---|---|---|
Sample parameter file (expert level)
You may run the program in the command line by providing the parameters via a text file:
seglayer2lattice --f parameterfile.txt
Where the format of the parameters is:
Analyze power spectrum                   = True
Power spectrum input image               = power.hdf
Batch mode                               = False
Diagnostic plot                          = seglayer2lattice_diag.pdf
Pixel size in Angstrom                   = 1.163
High-pass filter option                  = False
Low-pass filter option                   = True
High and low-pass filter cutoffs in 1/Angstrom = (0.001, 0.09)
Layer line/Bessel order or helical rise/rotation choice = rise/rotation
Layer line/Bessel or rise/rotation pair(s) = (0.03, 2); (0.06, -4); (0.09, 6)
Rotational symmetry                      = 1
Precise helix width in Angstrom          = 180
Command line options
When invoking seglayer2lattice, you may specify any of these options:
usage: seglayer2lattice [-h] [--g] [--p] [--f FILENAME] [--c] [--l LOGFILENAME] [--d DIRECTORY_NAME] [--version] [--analyze_power_spectrum]
                        [--batch_mode] [--high-pass_filter_option] [--low-pass_filter_option]
                        [input_output [input_output ...]]

Program to simulate helical diffraction pattern and plot helical lattice from a series of indexed layer lines or rise/rotation parameters

positional arguments:
  input_output          Input and output files

optional arguments:
  -h, --help            show this help message and exit
  --g, --GUI            GUI option: read input parameters from GUI
  --p, --promptuser     Prompt user option: read input parameters from prompt
  --f FILENAME, --parameterfile FILENAME
                        File option: read input parameters from FILENAME
  --c, --cmd            Command line parameter option: read only boolean input parameters from command line and all other parameters will be assigned
                        from other sources
  --l LOGFILENAME, --logfile LOGFILENAME
                        Output logfile name as specified
  --d DIRECTORY_NAME, --directory DIRECTORY_NAME
                        Output directory name as specified
  --version             show program's version number and exit
  --analyze_power_spectrum, --ana
                        Option to analyze experimental power spectrum. (default: False)
  --batch_mode, --bat   Batch mode for plot. Otherwise interactive. (default: False)
  --high-pass_filter_option, --hig
                        Option to high-pass filter images before alignment or band-pass filter in combination with low-pass filter. (default: False)
  --low-pass_filter_option, --low
                        Option to low-pass filter images before alignment or band-pass filter in combination with high-pass filter. (default: False)
Program flow
plot_layer_lines_to_power_and_lattice: Plots assigned layer lines to helical lattice


