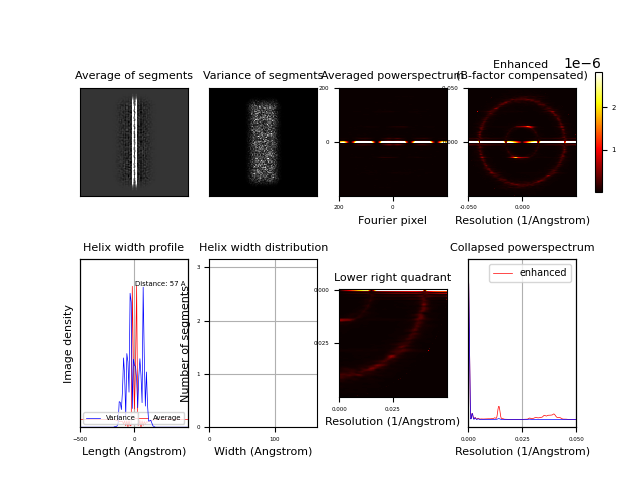
Segmentexam
Program to examine all excised in-plane rotated segments and compute their collapsed (1D) and 2D power spectrum and width profile of helices
Input: Image input stack
Output: Diagnostic plot

Parameters
Parameter |
Example (default) |
Description |
|---|---|---|
Image input stack |
protein_stack.hdf |
Input stack: accepted file formats (hdf). |
Diagnostic plot |
segmentexam_diag.pdf |
Output diagnostic plot: accepted file formats (pdf, .png, .bmp, .emf, .eps, .gif, .jpeg, .jpg, .ps, .raw, .rgba, .svg, .svgz, .tif, .tiff). |
Power spectrum output image |
power.hdf |
Output power spectrum image: accepted file formats (hdf). |
Pixel size in Angstrom |
1.163 |
Pixel size is an imaging parameter (accepted values min=0.001, max=100). |
Estimated helix width in Angstrom |
200 |
Generous width measure of helix required for rectangular mask (accepted values min=0, max=1500). |
spring.db file |
spring.db |
Program requires a combined spring.db from segment (and optional: micctfdetermine). An updated spring.db will be created in the working directory. |
Sample parameter file
You may run the program in the command line by providing the parameters via a text file:
segmentexam --f parameterfile.txt
Where the format of the parameters is:
Image input stack                        = protein_stack.hdf
Diagnostic plot                          = segmentexam_diag.pdf
Power spectrum output image              = power.hdf
Pixel size in Angstrom                   = 1.163
Estimated helix width in Angstrom        = 200
spring.db file                           = spring.db
Additional parameters (intermediate level)
Parameter |
Example (default) |
Description |
|---|---|---|
MPI option |
True |
OpenMPI installed (mpirun). |
Number of CPUs |
8 |
Number of processors to be used (accepted values min=1, max=1000). |
Temporary directory |
/tmp |
Temporary directory should have fast read and write access. |
Sample parameter file (intermediate level)
You may run the program in the command line by providing the parameters via a text file:
segmentexam --f parameterfile.txt
Where the format of the parameters is:
Image input stack                        = protein_stack.hdf
Diagnostic plot                          = segmentexam_diag.pdf
Power spectrum output image              = power.hdf
Pixel size in Angstrom                   = 1.163
Estimated helix width in Angstrom        = 200
spring.db file                           = spring.db
MPI option                               = True
Number of CPUs                           = 8
Temporary directory                      = /tmp
Additional parameters (expert level)
Parameter |
Example (default) |
Description |
|---|---|---|
Enhanced power spectrum option |
True |
Option to enhance power spectrum to compensate for decay of amplitudes. |
Enhanced power spectrum output image |
power_enhanced.hdf |
Output enhanced power spectrum image (compensated for decay of amplitudes): accepted file formats (hdf). |
Power spectrum resolution cutoff in 1/Angstrom |
0.15 |
Images are binned to obtain a suitable power spectrum (accepted values min=0, max=1). |
Compute layer-line correlation option |
False |
Compute layer line correlation of individual power spectra with average power spectrum and store this correlation value in the Spring database (spring.db). |
Layer-line region in 1/Angstrom |
(0.03, 0.035) |
Layer-line region to correlate individual power spectrum with sum of all power spectra (accepted values min=0, max=1). |
Reference power spectrum |
False |
Choose whether to provide a reference power spectrum for layer-line correlation. Make sure that the image dimensions agree with the input stack or with the binned input stack. If not chosen, sum of power spectra from input stack will be used. |
Power spectrum input image |
power.hdf |
Input power spectrum image: accepted file formats (hdf). |
Micrographs select option |
False |
Choose whether to select any particular micrographs. |
Include or exclude micrographs |
include |
Choose whether to ‘include’ or ‘exclude’ specified micrographs. |
Micrographs list |
1-9, 11, 13 |
List of comma-separated micrograph ids, e.g. ‘1-10, 12, 14’ (1st micrograph is 1). |
Helices select option |
False |
Choose whether to select any particular helices. |
Include or exclude helices |
include |
Choose whether to ‘include’ or ‘exclude’ specified helices. |
Helices list |
1-9, 11, 13 |
List of comma-separated helix ids, e.g. ‘1-10, 12, 14’ (1st helix is 1). |
Segments select option |
False |
Choose whether to select any particular segments. |
Include or exclude segments |
include |
Choose whether to ‘include’ or ‘exclude’ specified segments. |
Segment file |
stackid_file.dat |
File with single column of stack_ids. |
Classes select option |
False |
Choose whether to select any particular classes. |
Include or exclude classes |
include |
Choose whether to ‘include’ or ‘exclude’ specified classes. |
Class type |
class_id |
Choose class type either ‘class_id’ based on segmentclass assignments or ‘class_model_id’ based on segmultirefine3d/segclassmodel assigments. |
Classes list |
1-9, 11, 13 |
List of comma-separated class ids, e.g. ‘1-10, 12, 14’ (1st class is 0). |
Persistence class option |
False |
Choose whether to select segments from classes based on class assignments of neighboring segments. |
Persistence class length in Angstrom |
700 |
Length of helix window that will be used to average the class memberships of segments (accepted values min=1, max=5000). |
Class occupancy threshold |
0.5 |
Class occupancy threshold of segments (between 0 and 1) that belong to specified subset of classes within persistence length. Segments that have a lower occupancy will be excluded (accepted values min=0, max=1). |
Straightness select option |
False |
Choose whether to select any helices based on straightness. |
Include or exclude straight helices |
include |
Choose whether to ‘include’ or ‘exclude’ helices of specified persistence length. |
Persistence length range |
(80, 100) |
Range of persistence length in percent, i.e. upper 10 percent of distribution is expressed as 90 - 100 percent range, lower 20 percent is expressed as 0 - 20 percent etc. 90 - 100 % corresponds to most straight helices. Values from database are stored in m, e.g. ‘0-0.0001’ Persistence length is calculated as: p = -ln(2 * (end_to_end_distance / contour_length) ** 2 - 1) / contour_length)), i.e. short persistence lengths of 1 nm correspond to very flexible whereas 1 m corresponds to extremely straight helices. Examples are TMV: 2.9 mm (2.9e-3 m), amyloid beta filaments: 300 microm (3e-4 m) and DNA: 100 nm (1e-7 m). Due to the alignment error of the segments this value may not be absolutely comparable to determined persistence lengths by other methods but still be valid as a relative measure of straightness (accepted values min=0, max=100). |
Layer line correlation select option |
False |
Choose whether to select any segments based on layer-line cross-correlation coefficient. |
Include or exclude segments based on layer-line correlation |
include |
Choose whether to ‘include’ or ‘exclude’ segments of specified cross correlation coefficient with layer lines. |
Correlation layer line range |
(60, 100) |
Range of cross-correlation between layer lines of power spectrum average and segment in percent. i.e. upper 10 percent of distribution is expressed as 90 - 100 percent range, lower 20 percent is expressed as 0 - 20 percent etc. Values in database are stored as cross correlation coefficient, e.g. ‘0.5 - 1.0’ (accepted values min=0, max=100). |
Defocus select option |
False |
Choose whether to select any segments based on defocus. |
Include or exclude defocus range |
include |
Choose whether to ‘include’ or ‘exclude’ segments of specified defocus. |
Defocus range |
(10000, 40000) |
Range of defocus in Angstrom, e.g. ‘10000-40000’ (accepted values min=0, max=100000). |
Astigmatism select option |
False |
Choose whether to select any segments based on astigmatism. |
Include or exclude astigmatic segments |
include |
Choose whether to ‘include’ or ‘exclude’ segments of specified astigmatism amplitude in Angstrom. |
Astigmatism range |
(0, 4000) |
Range of astigmatism amplitude (difference between defocus one and two) in Angstrom, e.g. ‘0-4000’ (accepted values min=0, max=100000). |
Sample parameter file (expert level)
You may run the program in the command line by providing the parameters via a text file:
segmentexam --f parameterfile.txt
Where the format of the parameters is:
Image input stack                        = protein_stack.hdf
Diagnostic plot                          = segmentexam_diag.pdf
Power spectrum output image              = power.hdf
Enhanced power spectrum option           = True
Enhanced power spectrum output image     = power_enhanced.hdf
Pixel size in Angstrom                   = 1.163
Estimated helix width in Angstrom        = 200
Power spectrum resolution cutoff in 1/Angstrom = 0.15
Compute layer-line correlation option    = False
Layer-line region in 1/Angstrom          = (0.03, 0.035)
Reference power spectrum                 = False
Power spectrum input image               = power.hdf
spring.db file                           = spring.db
Micrographs select option                = False
Include or exclude micrographs           = include
Micrographs list                         = 1-9, 11, 13
Helices select option                    = False
Include or exclude helices               = include
Helices list                             = 1-9, 11, 13
Segments select option                   = False
Include or exclude segments              = include
Segment file                             = stackid_file.dat
Classes select option                    = False
Include or exclude classes               = include
Class type                               = class_id
Classes list                             = 1-9, 11, 13
Persistence class option                 = False
Persistence class length in Angstrom     = 700
Class occupancy threshold                = 0.5
Straightness select option               = False
Include or exclude straight helices      = include
Persistence length range                 = (80, 100)
Layer line correlation select option     = False
Include or exclude segments based on layer-line correlation = include
Correlation layer line range             = (60, 100)
Defocus select option                    = False
Include or exclude defocus range         = include
Defocus range                            = (10000, 40000)
Astigmatism select option                = False
Include or exclude astigmatic segments   = include
Astigmatism range                        = (0, 4000)
MPI option                               = True
Number of CPUs                           = 8
Temporary directory                      = /tmp
Command line options
When invoking segmentexam, you may specify any of these options:
usage: segmentexam [-h] [--g] [--p] [--f FILENAME] [--c] [--l LOGFILENAME] [--d DIRECTORY_NAME] [--version] [--enhanced_power_spectrum_option]
                   [--compute_layer-line_correlation_option] [--reference_power_spectrum] [--micrographs_select_option] [--helices_select_option]
                   [--segments_select_option] [--classes_select_option] [--persistence_class_option] [--straightness_select_option]
                   [--layer_line_correlation_select_option] [--defocus_select_option] [--astigmatism_select_option] [--mpi_option]
                   [input_output [input_output ...]]

Program to examine all excised in-plane rotated segments and compute their collapsed (1D) and 2D power spectrum and width profile of helices

positional arguments:
  input_output          Input and output files

optional arguments:
  -h, --help            show this help message and exit
  --g, --GUI            GUI option: read input parameters from GUI
  --p, --promptuser     Prompt user option: read input parameters from prompt
  --f FILENAME, --parameterfile FILENAME
                        File option: read input parameters from FILENAME
  --c, --cmd            Command line parameter option: read only boolean input parameters from command line and all other parameters will be assigned
                        from other sources
  --l LOGFILENAME, --logfile LOGFILENAME
                        Output logfile name as specified
  --d DIRECTORY_NAME, --directory DIRECTORY_NAME
                        Output directory name as specified
  --version             show program's version number and exit
  --enhanced_power_spectrum_option, --enh
                        Option to enhance power spectrum to compensate for decay of amplitudes. (default: False)
  --compute_layer-line_correlation_option, --com
                        Compute layer line correlation of individual power spectra with average power spectrum and store this correlation value in the
                        Spring database (spring.db). (default: False)
  --reference_power_spectrum, --ref
                        Choose whether to provide a reference power spectrum for layer-line correlation. Make sure that the image dimensions agree
                        with the input stack or with the binned input stack. If not chosen, sum of power spectra from input stack will be used.
                        (default: False)
  --micrographs_select_option, --mic
                        Choose whether to select any particular micrographs. (default: False)
  --helices_select_option, --hel
                        Choose whether to select any particular helices. (default: False)
  --segments_select_option, --seg
                        Choose whether to select any particular segments. (default: False)
  --classes_select_option, --cla
                        Choose whether to select any particular classes. (default: False)
  --persistence_class_option, --per
                        Choose whether to select segments from classes based on class assignments of neighboring segments. (default: False)
  --straightness_select_option, --str
                        Choose whether to select any helices based on straightness. (default: False)
  --layer_line_correlation_select_option, --lay
                        Choose whether to select any segments based on layer-line cross-correlation coefficient. (default: False)
  --defocus_select_option, --def
                        Choose whether to select any segments based on defocus. (default: False)
  --astigmatism_select_option, --ast
                        Choose whether to select any segments based on astigmatism. (default: False)
  --mpi_option, --mpi   OpenMPI installed (mpirun). (default: False)
Program flow
add_power_spectra_from_verticalized_stack: Addition of in-plane rotated power spectra
determine_width: Determine width of helix by projection along helical axis
visualize_power_avg_and_width_analysis: Visualization of width and power spectra