Segmentplot
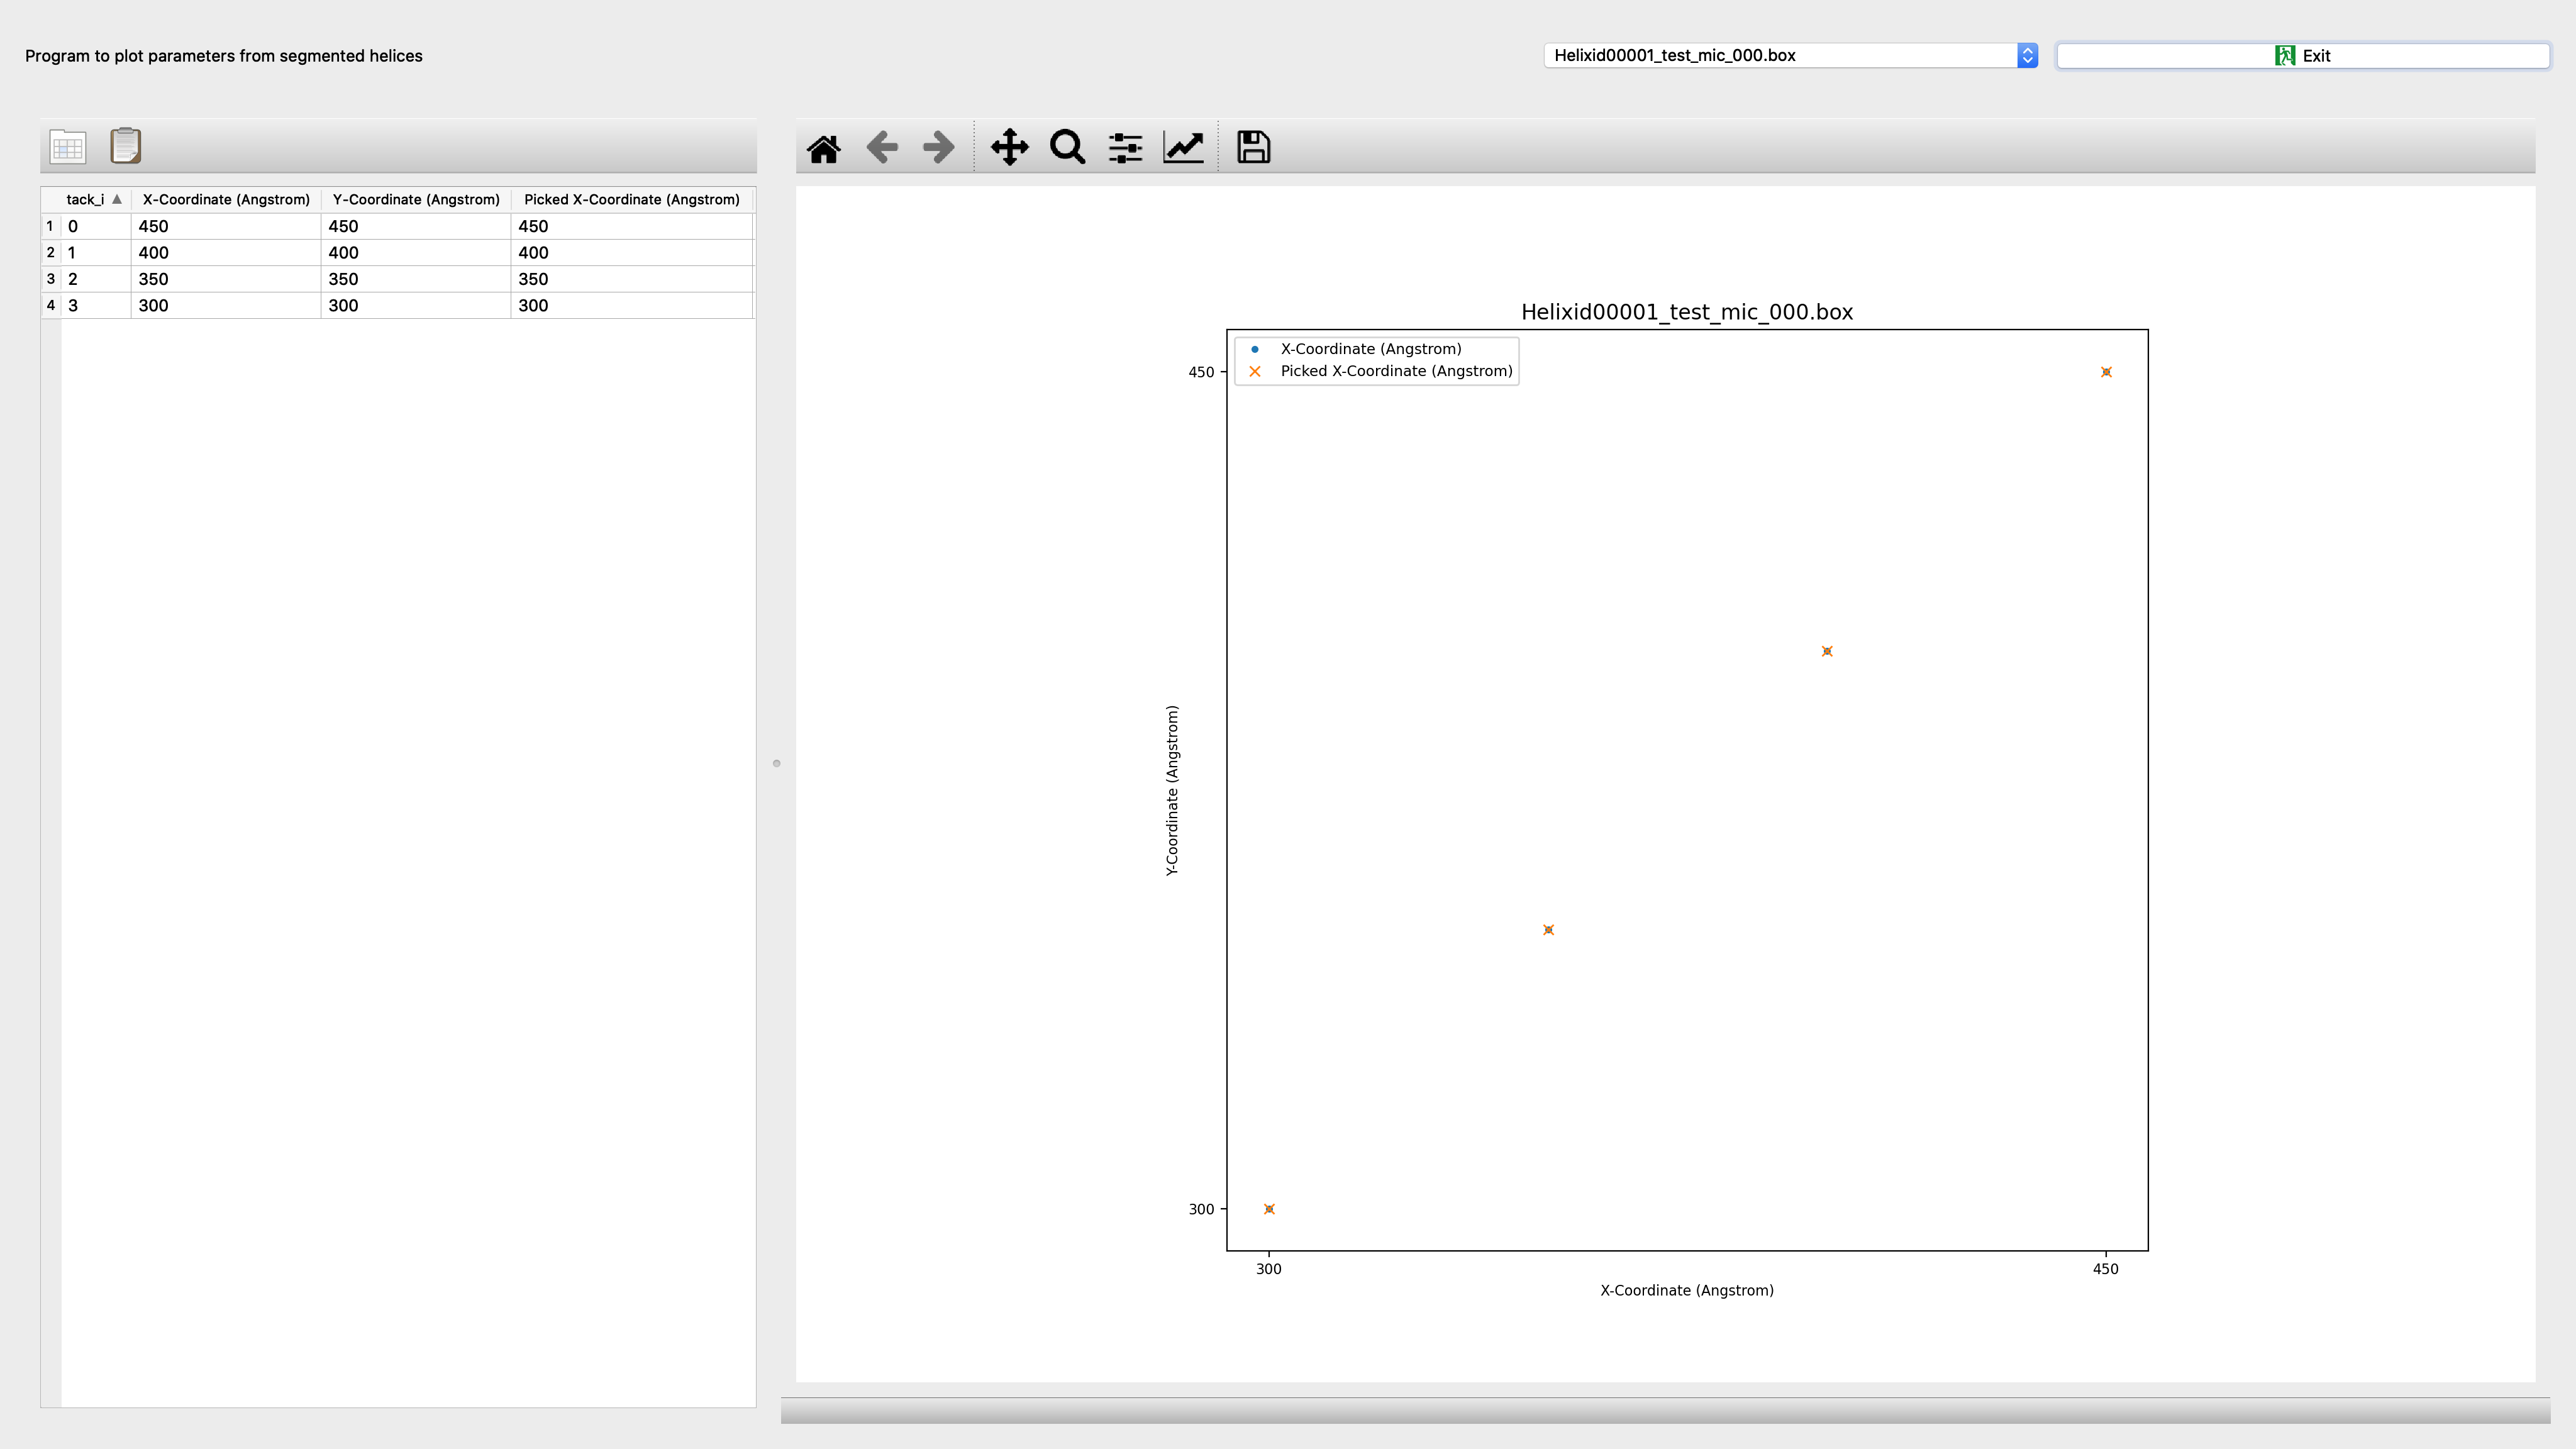
Program to plot parameters from segmented helices
Input: spring.db file
Output: Interactive screenshot
Parameters
Parameter |
Example (default) |
Description |
|---|---|---|
spring.db file |
spring.db |
Requires spring.db from segment to plot helix parameters. |
Batch mode |
False |
Batch mode for plot. Otherwise interactive. |
Quantities |
coordinates |
Quantities to be plotted: ‘coordinates’: X-Coordinate (Angstrom) vs. Y-Coordinate (Angstrom); Picked X-Coordinate (Angstrom) vs. Picked Y-Coordinate (Angstrom); ‘in-plane_rotation’: Distance Along Helix (Angstrom) vs. In-Plane Rotation Angle (Degrees) (Distance Along Helix (Angstrom) of segment center from helix start, In-Plane Rotation Angle (Degrees) of segment based on picked coordinates); ‘curvature’: Distance Along Helix (Angstrom) vs. Curvature (Distance Along Helix (Angstrom) of segment center from helix start, Curvature of segment based on coordinates); ‘defocus’: Distance Along Helix (Angstrom) vs. Average Defocus (Angstrom) (Distance Along Helix (Angstrom) of segment center from helix start, Average Defocus (Angstrom) determined by CTFFIND or CTFTILT); ‘astigmatism’: Distance Along Helix (Angstrom) vs. Astigmatism (Angstrom) (Distance Along Helix (Angstrom) of segment center from helix start, Astigmatism (Angstrom) determined by CTFFIND or CTFTILT); ‘layer-line correlation’: Distance Along Helix (Angstrom) vs. Amplitude Correlation (Distance Along Helix (Angstrom) of segment center from helix start, Amplitude Correlation along layer-line region of segment); ‘classes’: Distance Along Helix (Angstrom) vs. Class Id (Distance Along Helix (Angstrom) of segment center from helix start, Class Id Assigned class id based on classification); |
Sample parameter file
You may run the program in the command line by providing the parameters via a text file:
segmentplot --f parameterfile.txt
Where the format of the parameters is:
spring.db file                           = spring.db
Batch mode                               = False
Quantities                               = coordinates
Additional parameters (intermediate level)
Parameter |
Example (default) |
Description |
|---|---|---|
Diagnostic plot prefix |
diagnostic_plot.pdf |
Output name for diagnostic plots of iterative structure refinement (completion to ‘prefix_XXX.ext’): accepted file formats (pdf, .png, .bmp, .emf, .eps, .gif, .jpeg, .jpg, .ps, .raw, .rgba, .svg, .svgz, .tif, .tiff). |
Sample parameter file (intermediate level)
You may run the program in the command line by providing the parameters via a text file:
segmentplot --f parameterfile.txt
Where the format of the parameters is:
spring.db file                           = spring.db
Batch mode                               = False
Diagnostic plot prefix                   = diagnostic_plot.pdf
Quantities                               = coordinates
Additional parameters (expert level)
Parameter |
Example (default) |
Description |
|---|---|---|
Set size |
helix |
Choose set size to plot: chosen quantity per ‘helix’, ‘micrograph’ or ‘data_set’. |
Micrographs select option |
False |
Choose whether to select any particular micrographs. |
Include or exclude micrographs |
include |
Choose whether to ‘include’ or ‘exclude’ specified micrographs. |
Micrographs list |
1-9, 11, 13 |
List of comma-separated micrograph ids, e.g. ‘1-10, 12, 14’ (1st micrograph is 1). |
Helices select option |
False |
Choose whether to select any particular helices. |
Include or exclude helices |
include |
Choose whether to ‘include’ or ‘exclude’ specified helices. |
Helices list |
1-9, 11, 13 |
List of comma-separated helix ids, e.g. ‘1-10, 12, 14’ (1st helix is 1). |
Segments select option |
False |
Choose whether to select any particular segments. |
Include or exclude segments |
include |
Choose whether to ‘include’ or ‘exclude’ specified segments. |
Segment file |
stackid_file.dat |
File with single column of stack_ids. |
Classes select option |
False |
Choose whether to select any particular classes. |
Include or exclude classes |
include |
Choose whether to ‘include’ or ‘exclude’ specified classes. |
Class type |
class_id |
Choose class type either ‘class_id’ based on segmentclass assignments or ‘class_model_id’ based on segmultirefine3d/segclassmodel assigments. |
Classes list |
1-9, 11, 13 |
List of comma-separated class ids, e.g. ‘1-10, 12, 14’ (1st class is 0). |
Persistence class option |
False |
Choose whether to select segments from classes based on class assignments of neighboring segments. |
Persistence class length in Angstrom |
700 |
Length of helix window that will be used to average the class memberships of segments (accepted values min=1, max=5000). |
Class occupancy threshold |
0.5 |
Class occupancy threshold of segments (between 0 and 1) that belong to specified subset of classes within persistence length. Segments that have a lower occupancy will be excluded (accepted values min=0, max=1). |
Straightness select option |
False |
Choose whether to select any helices based on straightness. |
Include or exclude straight helices |
include |
Choose whether to ‘include’ or ‘exclude’ helices of specified persistence length. |
Persistence length range |
(80, 100) |
Range of persistence length in percent, i.e. upper 10 percent of distribution is expressed as 90 - 100 percent range, lower 20 percent is expressed as 0 - 20 percent etc. 90 - 100 % corresponds to most straight helices. Values from database are stored in m, e.g. ‘0-0.0001’ Persistence length is calculated as: p = -ln(2 * (end_to_end_distance / contour_length) ** 2 - 1) / contour_length)), i.e. short persistence lengths of 1 nm correspond to very flexible whereas 1 m corresponds to extremely straight helices. Examples are TMV: 2.9 mm (2.9e-3 m), amyloid beta filaments: 300 microm (3e-4 m) and DNA: 100 nm (1e-7 m). Due to the alignment error of the segments this value may not be absolutely comparable to determined persistence lengths by other methods but still be valid as a relative measure of straightness (accepted values min=0, max=100). |
Layer line correlation select option |
False |
Choose whether to select any segments based on layer-line cross-correlation coefficient. |
Include or exclude segments based on layer-line correlation |
include |
Choose whether to ‘include’ or ‘exclude’ segments of specified cross correlation coefficient with layer lines. |
Correlation layer line range |
(60, 100) |
Range of cross-correlation between layer lines of power spectrum average and segment in percent. i.e. upper 10 percent of distribution is expressed as 90 - 100 percent range, lower 20 percent is expressed as 0 - 20 percent etc. Values in database are stored as cross correlation coefficient, e.g. ‘0.5 - 1.0’ (accepted values min=0, max=100). |
Defocus select option |
False |
Choose whether to select any segments based on defocus. |
Include or exclude defocus range |
include |
Choose whether to ‘include’ or ‘exclude’ segments of specified defocus. |
Defocus range |
(10000, 40000) |
Range of defocus in Angstrom, e.g. ‘10000-40000’ (accepted values min=0, max=100000). |
Astigmatism select option |
False |
Choose whether to select any segments based on astigmatism. |
Include or exclude astigmatic segments |
include |
Choose whether to ‘include’ or ‘exclude’ segments of specified astigmatism amplitude in Angstrom. |
Astigmatism range |
(0, 4000) |
Range of astigmatism amplitude (difference between defocus one and two) in Angstrom, e.g. ‘0-4000’ (accepted values min=0, max=100000). |
Sample parameter file (expert level)
You may run the program in the command line by providing the parameters via a text file:
segmentplot --f parameterfile.txt
Where the format of the parameters is:
spring.db file                           = spring.db
Batch mode                               = False
Diagnostic plot prefix                   = diagnostic_plot.pdf
Quantities                               = coordinates
Set size                                 = helix
Micrographs select option                = False
Include or exclude micrographs           = include
Micrographs list                         = 1-9, 11, 13
Helices select option                    = False
Include or exclude helices               = include
Helices list                             = 1-9, 11, 13
Segments select option                   = False
Include or exclude segments              = include
Segment file                             = stackid_file.dat
Classes select option                    = False
Include or exclude classes               = include
Class type                               = class_id
Classes list                             = 1-9, 11, 13
Persistence class option                 = False
Persistence class length in Angstrom     = 700
Class occupancy threshold                = 0.5
Straightness select option               = False
Include or exclude straight helices      = include
Persistence length range                 = (80, 100)
Layer line correlation select option     = False
Include or exclude segments based on layer-line correlation = include
Correlation layer line range             = (60, 100)
Defocus select option                    = False
Include or exclude defocus range         = include
Defocus range                            = (10000, 40000)
Astigmatism select option                = False
Include or exclude astigmatic segments   = include
Astigmatism range                        = (0, 4000)
Command line options
When invoking segmentplot, you may specify any of these options:
usage: segmentplot [-h] [--g] [--p] [--f FILENAME] [--c] [--l LOGFILENAME] [--d DIRECTORY_NAME] [--version] [--batch_mode]
                   [--micrographs_select_option] [--helices_select_option] [--segments_select_option] [--classes_select_option]
                   [--persistence_class_option] [--straightness_select_option] [--layer_line_correlation_select_option] [--defocus_select_option]
                   [--astigmatism_select_option]
                   [input_output [input_output ...]]

Program to plot parameters from segmented helices

positional arguments:
  input_output          Input and output files

optional arguments:
  -h, --help            show this help message and exit
  --g, --GUI            GUI option: read input parameters from GUI
  --p, --promptuser     Prompt user option: read input parameters from prompt
  --f FILENAME, --parameterfile FILENAME
                        File option: read input parameters from FILENAME
  --c, --cmd            Command line parameter option: read only boolean input parameters from command line and all other parameters will be assigned
                        from other sources
  --l LOGFILENAME, --logfile LOGFILENAME
                        Output logfile name as specified
  --d DIRECTORY_NAME, --directory DIRECTORY_NAME
                        Output directory name as specified
  --version             show program's version number and exit
  --batch_mode, --bat   Batch mode for plot. Otherwise interactive. (default: False)
  --micrographs_select_option, --mic
                        Choose whether to select any particular micrographs. (default: False)
  --helices_select_option, --hel
                        Choose whether to select any particular helices. (default: False)
  --segments_select_option, --seg
                        Choose whether to select any particular segments. (default: False)
  --classes_select_option, --cla
                        Choose whether to select any particular classes. (default: False)
  --persistence_class_option, --per
                        Choose whether to select segments from classes based on class assignments of neighboring segments. (default: False)
  --straightness_select_option, --str
                        Choose whether to select any helices based on straightness. (default: False)
  --layer_line_correlation_select_option, --lay
                        Choose whether to select any segments based on layer-line cross-correlation coefficient. (default: False)
  --defocus_select_option, --def
                        Choose whether to select any segments based on defocus. (default: False)
  --astigmatism_select_option, --ast
                        Choose whether to select any segments based on astigmatism. (default: False)
Program flow
get_quantities_per_set: Extract desired quantities from spring database
plot_data_on_figure: Prepare figures with desired quantities